Chart Window
Analyze sampled and aggregated market data
Click on “Data” in the App Menu, and click on “Chart”. A new chart window is opened.
This window is linkable to a bench or watchlist to switch the asset.
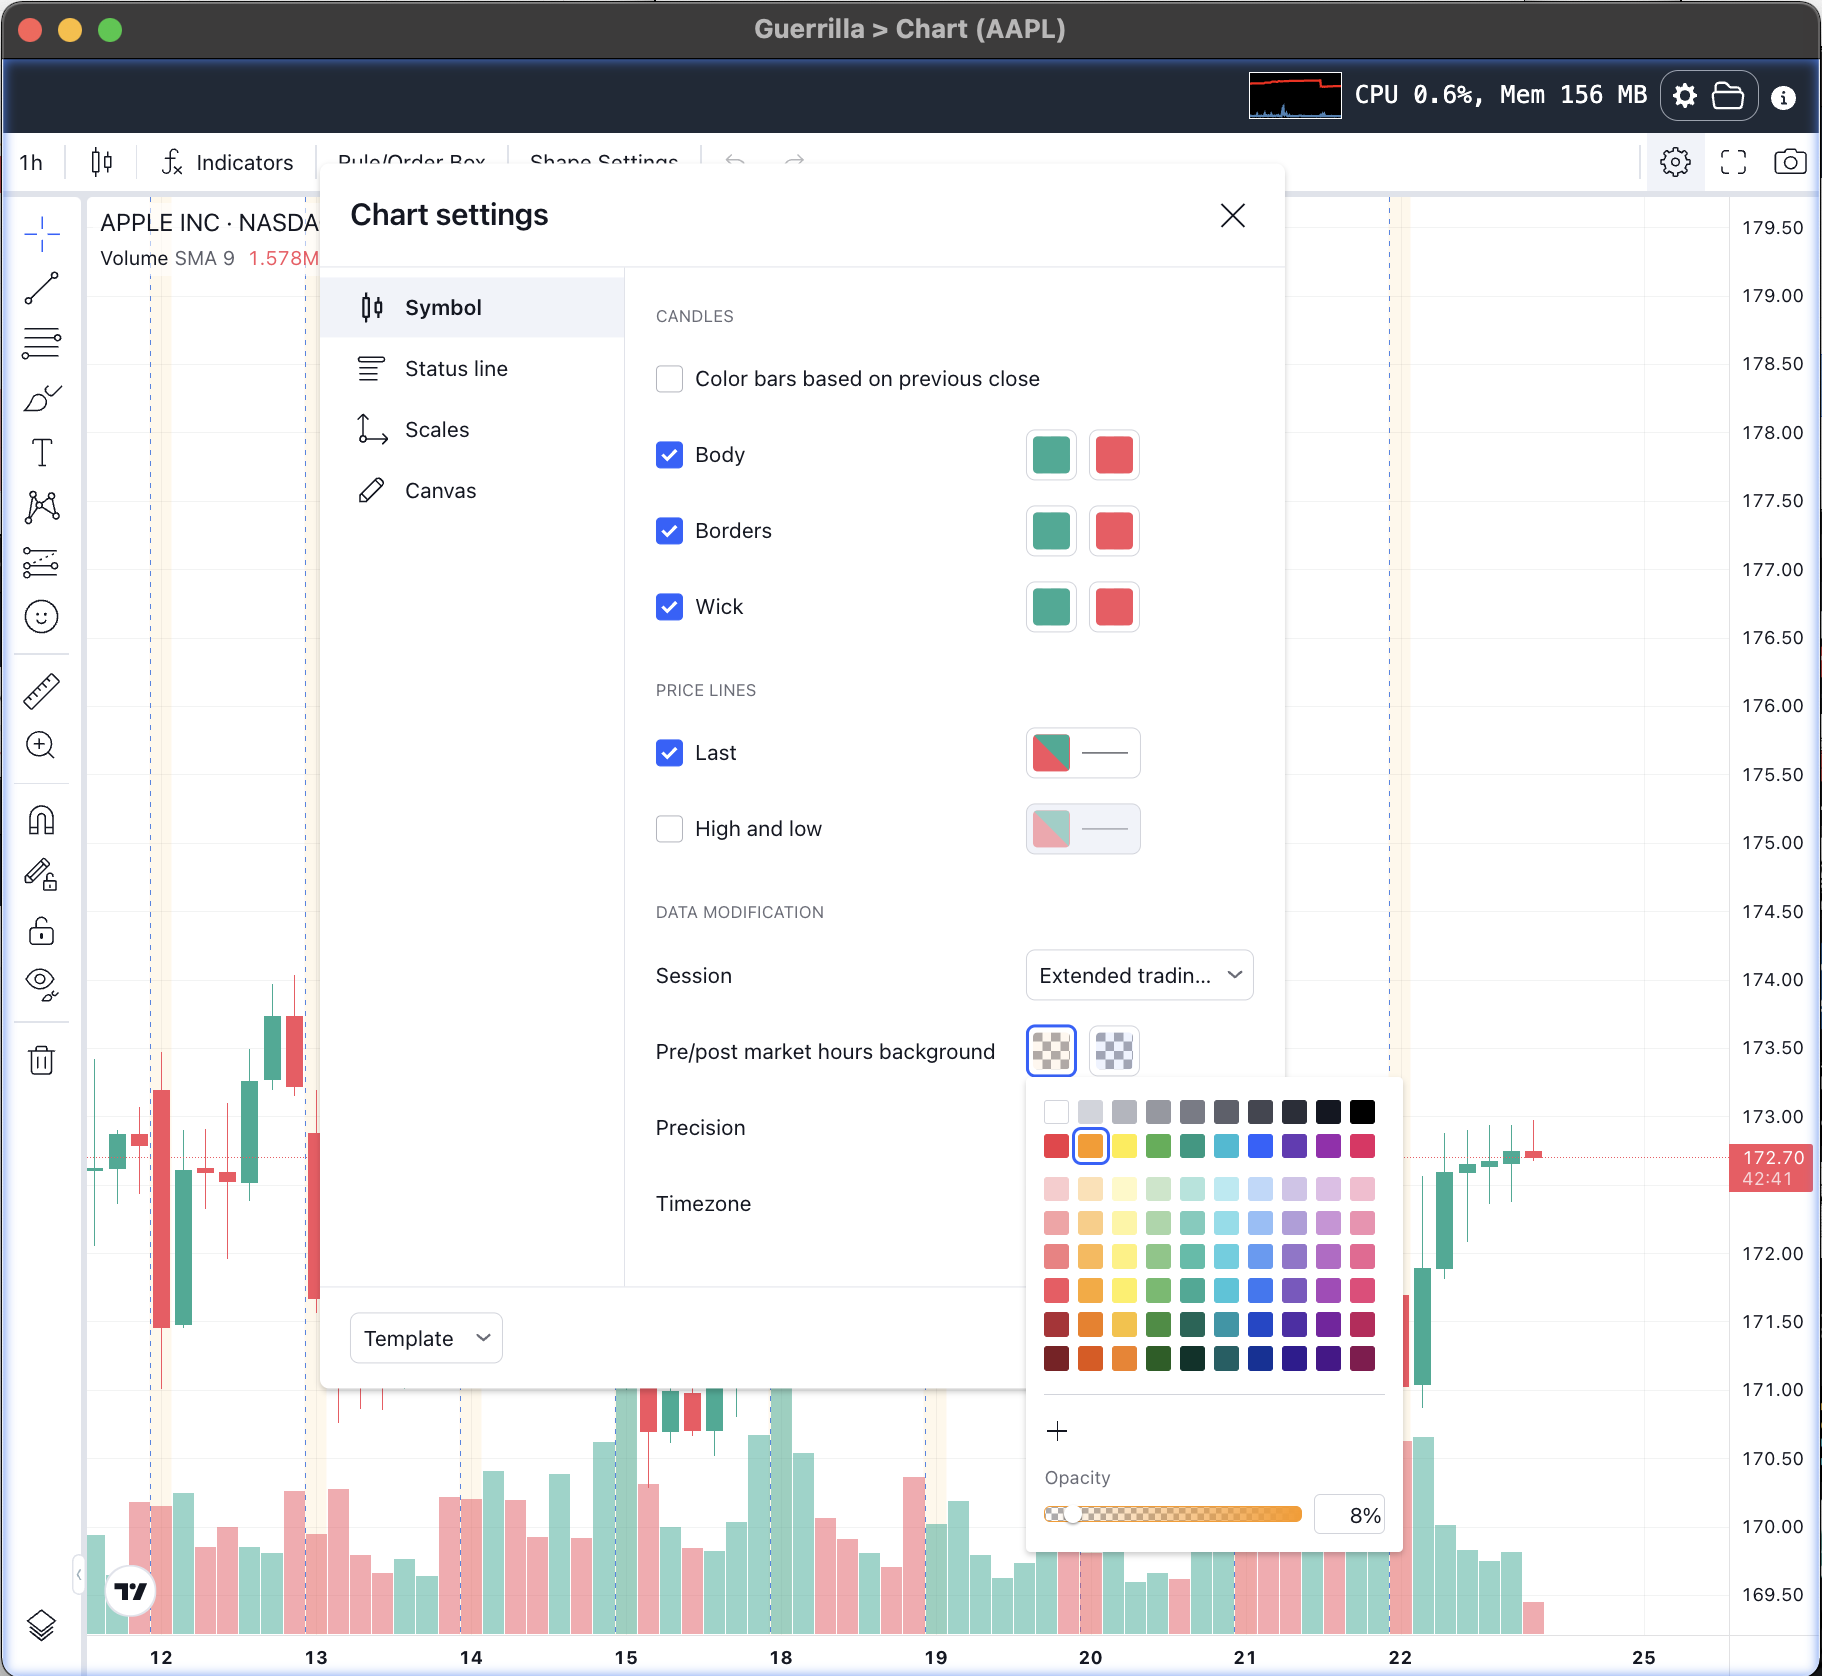
To configure the chart, click on the lower gear icon on the top-right. A modal opens in which you adjust settings such as the timezone and the background color of pre- and post-market sessions
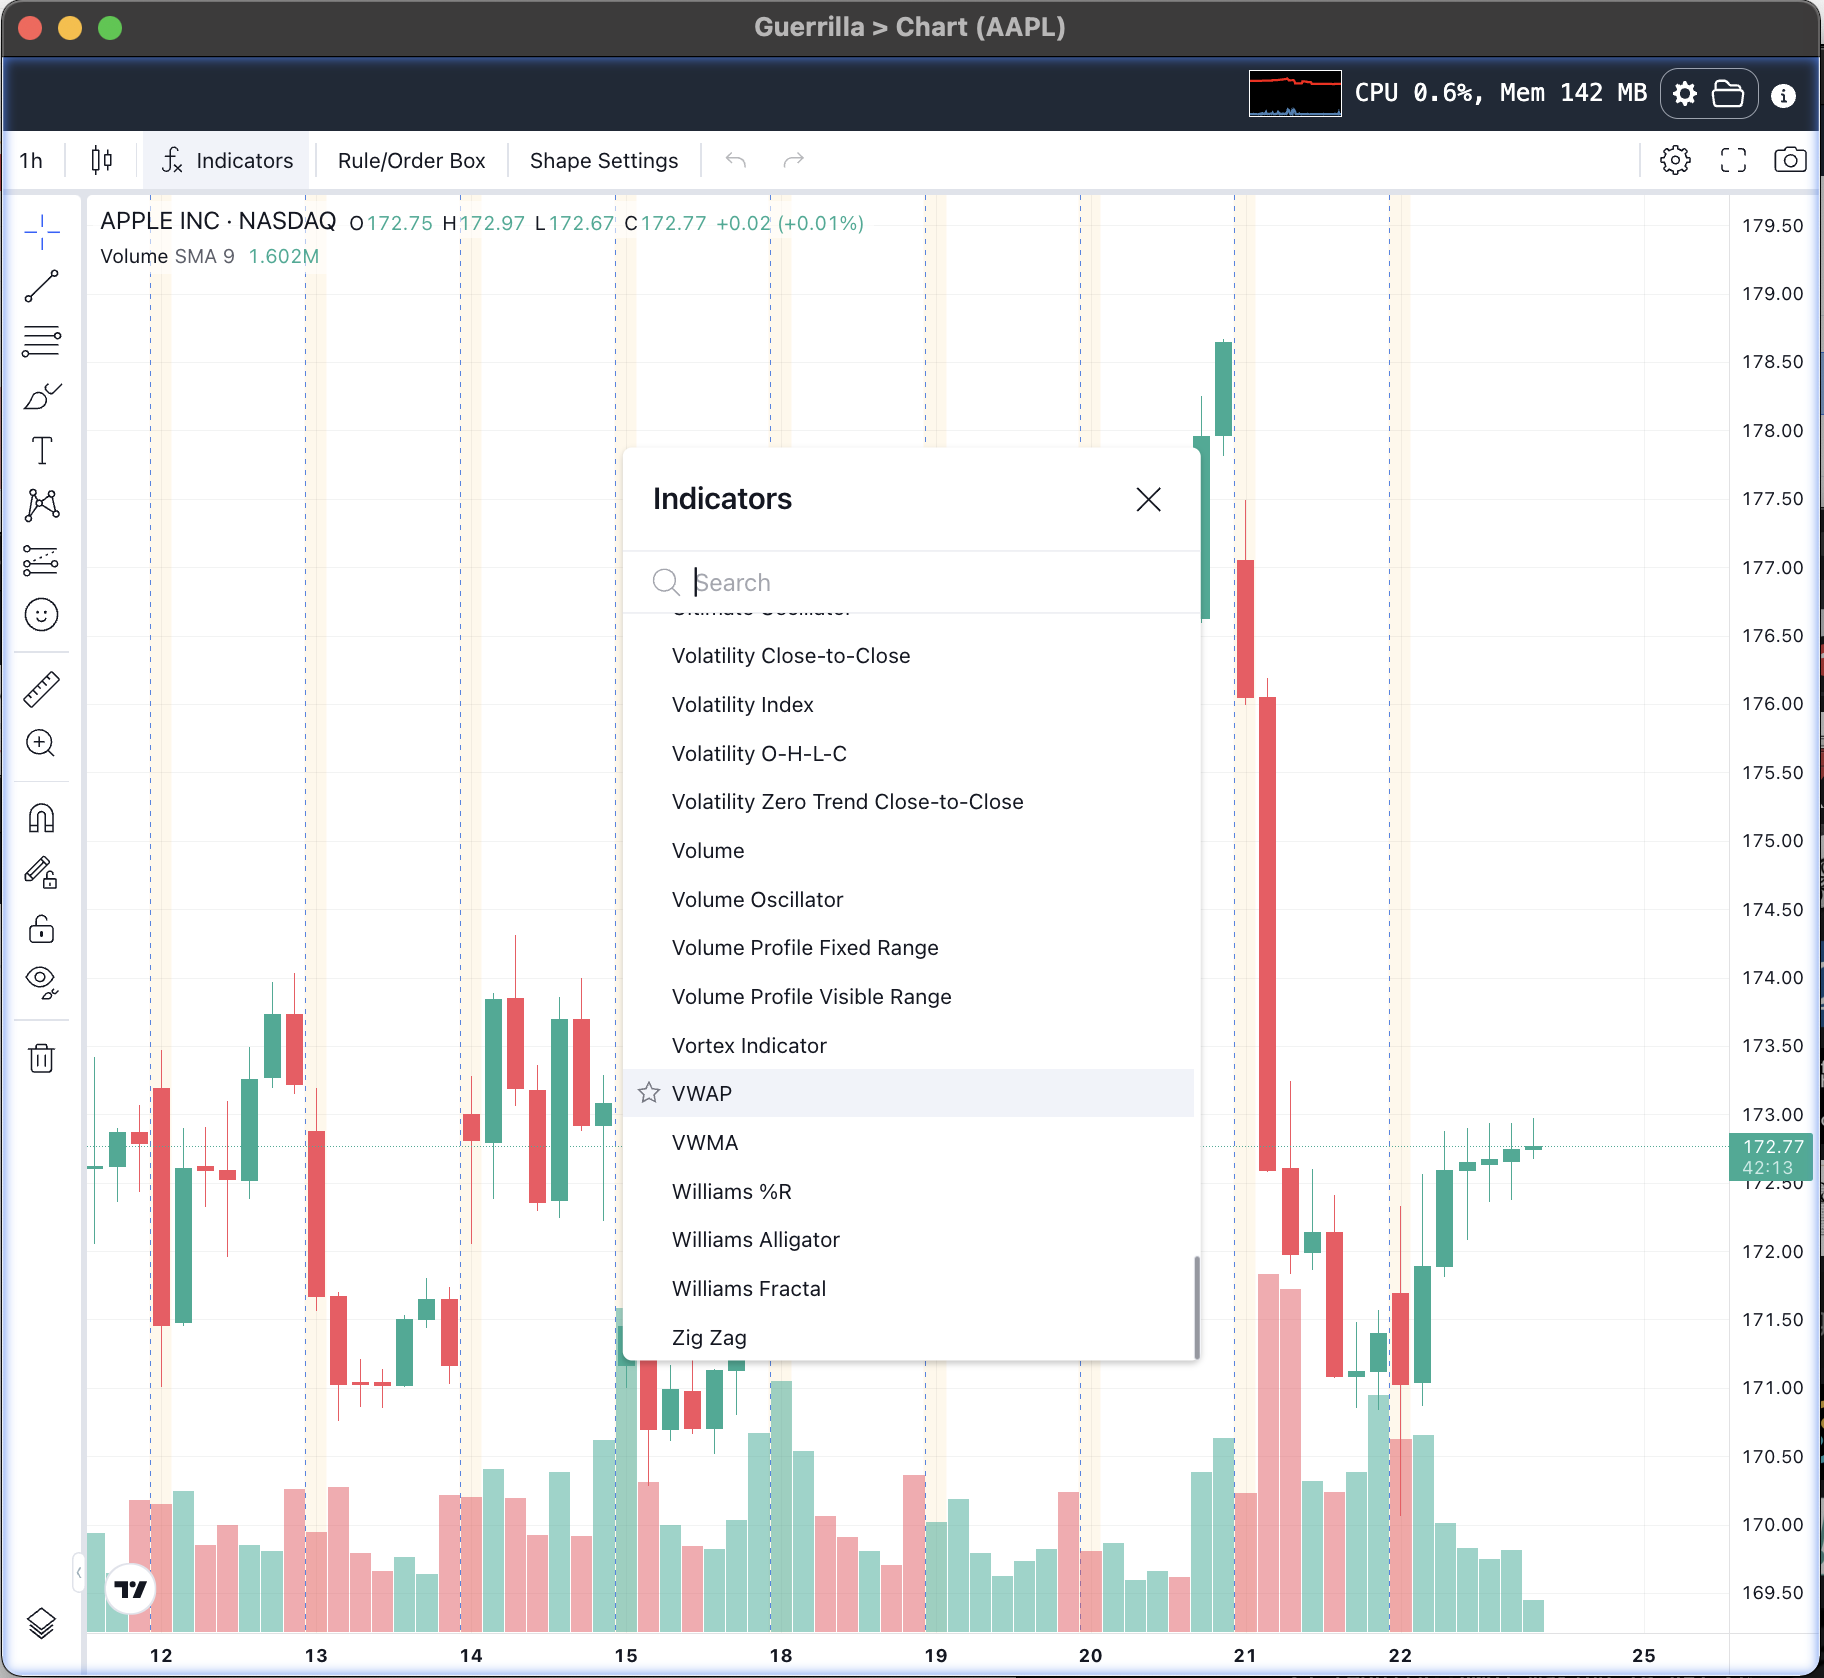
The chart package in Guerrilla which is powered by TradingView Charting Library, ships with hundreds of indicators by default. To add an indicator to the chart, click on “fx indicators” on the chart, and search/select an appropriate indicator from the resulting modal